
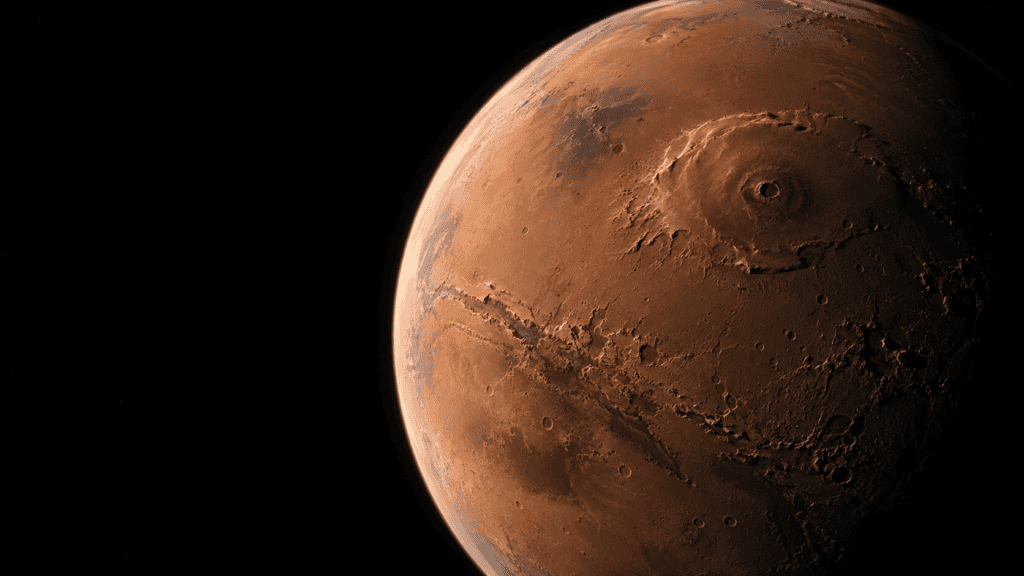
A flashlight is enough to make a cardboard model stop looking flat. Turn it slightly and valleys, edges and craters appear — features that were there before but that the eye could not read. Something similar happens on Mars, except the flashlight is in a computer and the model is an entire planet. Mars’s shaded-relief map is not an aerial photograph: it is a topographic reconstruction illuminated by a virtual light source.
The trick has a little theater and a great deal of science. The USGS explains that its shaded-relief maps are built from digital elevation models. Every pixel receives a height, and software calculates how it would look if an imaginary lamp lit the terrain from a particular angle. The shadows do not prove the Sun was there; they are a convention that gives a mathematical surface volume to our eyes.

The mission that measured a planet with pulses of light
Much of the raw material came from MOLA, the Mars Orbiter Laser Altimeter aboard Mars Global Surveyor. The instrument sent laser pulses toward the ground and measured the time they took to return. With millions of readings, scientists built a global topography. NASA’s MOLA overview captures the key idea: the altimeter does not “photograph” a mountain; it calculates its height.
That makes it possible to put numbers on the planet’s geological giants. Olympus Mons rises about 22 kilometers above the Martian datum, almost three times Everest’s height using the usual references. Valles Marineris extends roughly 4,000 kilometers. On the map, the volcano looks like a bump and the canyon like a scar; in reality, they exceed the scale of any terrestrial landscape.
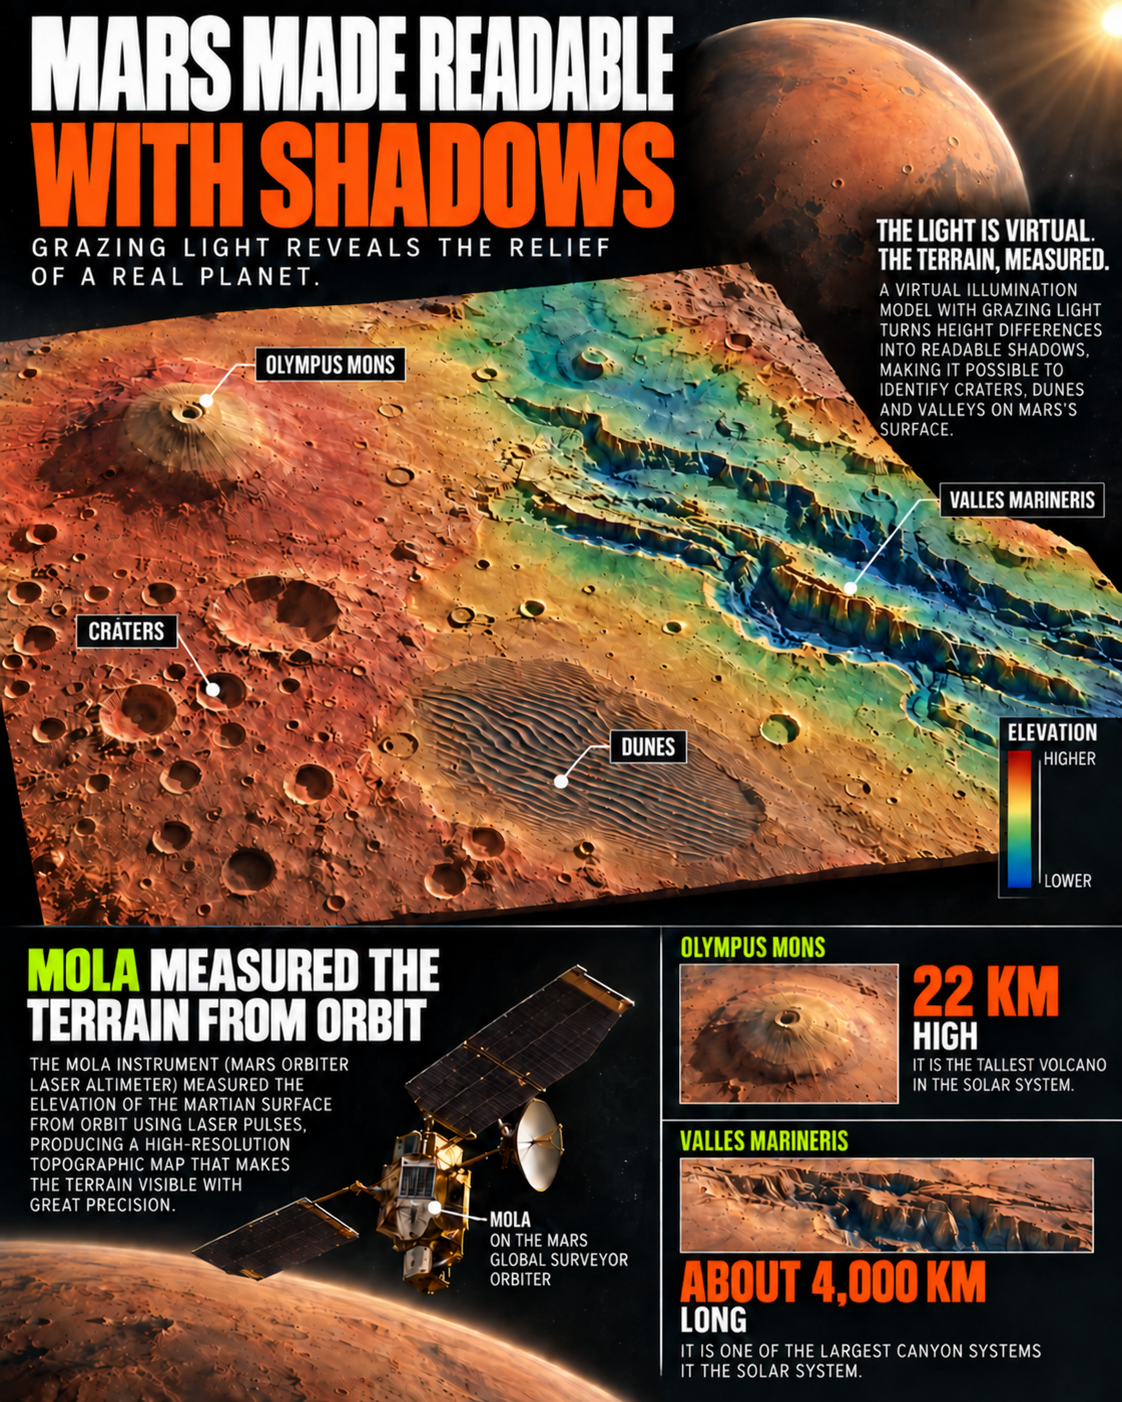
The image is slightly deceptive — and that is part of its charm — because relief is often vertically exaggerated. At strict scale, many slopes would be too subtle to distinguish on a screen. The cartographer increases height contrast so the eye can understand the form. It is like turning up the volume on a song: it does not invent the melody, but makes it perceptible.
A shadow is not enough to measure a mountain
A long shadow can suggest a steep slope, but it does not on its own provide a reliable elevation. Its length depends on the angle of the light, the map projection and the observer’s position. That is why shading is combined with the elevation model. The IAU’s official nomenclature also helps prevent names, regions and features from being confused in an image that can make them appear part of one continuous drawing.
To see the process in motion, this YouTube video helps complete the explanation:
High-resolution photographs from the Mars Reconnaissance Orbiter provide a contrast. A camera shows textures, dunes and specific deposits; the shaded map lets us follow the landscape’s complete architecture. One image puts your nose near the ground. The other restores context.
The result has an intriguing narrative consequence: the more the map resembles a photograph, the more invisible work it contains. There is an orbital mission, a mathematical model, a projection, a decision about the light and a carefully chosen scale. The blotches some people read as faces or ruins are pareidolia — the brain completing familiar patterns where there is only topography.
Three scales for not getting lost on the red planet
It helps to read the map as we read a landscape while traveling. First comes the planetary scale: the Borealis basin occupies an enormous extent and the southern hemisphere preserves a higher, more cratered crust. Then comes the regional scale, where Olympus Mons, Tharsis and Valles Marineris stop being isolated names and form a related architecture. Finally there is the local scale: dunes, alluvial fans and crater rims that only a high-resolution camera can show in detail.
That hierarchy explains why downloading a spectacular photograph is not enough. An orbital image can show extraordinary texture while saying nothing about whether it is a slope, a terrace or a lighting difference. The MOLA map adds continuity: every area can be compared with those around it, and the reading depends less on whether dust or camera angle favors a particular landform. In planetary cartography, context is a form of quality control.
Color also needs care. Many maps combine gray shading with a chromatic ramp from blues to reds to represent heights. That code does not mean Mars has blue oceans and red mountains. It is a visual translation, just as a thermometer translates temperature into a column of mercury. When an image is shared without its legend, the map can become a small factory of misunderstandings.
The mission video is useful because it makes that invisible work visible: the spacecraft passes over the planet, a pulse bounces back and isolated points become a surface. No camera is drawing mountains through a window. There are repeated measurements, orbital corrections and models compared until the pieces fit. The result is less romantic than a postcard but far more compelling: a mountain nobody has climbed can be measured precisely enough for its slope to be discussed from an office on Earth.
Cartography is not neutral in the everyday sense either. Putting north at the top, choosing the light direction or exaggerating height changes the story a map tells. It does not change the existence of Valles Marineris, but it changes what catches our attention first. That is why shaded relief works so well for explanation: it does not eliminate complexity; it orders it. It gives the eye an entrance so that numbers, geology and questions about how each structure formed can follow.
Returning to the cardboard-model comparison completes the trick. The flashlight does not create the cardboard mountain, and virtual light does not create Olympus Mons. Both do something more modest and more honest: they turn a hard-to-read surface into a form the brain can travel across. Mars was not drawn with shadows. It was measured with lasers and then illuminated so we could read it. The shadow is not the data; it is the translator.
The next time a Martian image looks like an aerial photograph, it is worth pausing for a moment. Asking where the light comes from, what each color measures and which relief has been exaggerated does not take magic away from the scene. It adds a story: that of a planet turned into a map without anyone having to place a camera on its surface.
Even interpretation errors are useful. If a ridge looks like a wall or a crater like a doorway, checking other angles and models can explain why the brain completes familiar forms. Planetary cartography does not eliminate imagination; it gives it better data to work with.

Sources consulted for this article
- USGS Astrogeology: Mars shaded-relief map — Base cartographic product and technical record for the global relief map.
- Wikimedia Commons: Mars topography (MOLA dataset) — NASA image record, shaded-relief description and public-domain reference.
- NASA MGS: MOLA instrument — How the laser altimeter measured Martian topography from orbit.
- NASA: Olympus Mons — Scale reference for the solar system’s largest known volcano.
- NASA: Valles Marineris — Context for the immense equatorial canyon system.
- NASA Mars Reconnaissance Orbiter — Mission imagery used to compare relief with high-resolution photographs.
- IAU/USGS Gazetteer of Planetary Nomenclature — Official names and locations of leading regions and geographic features.